After reading Tanel Poder’s remarkable Achieving 11M IOPS & 66 GB/s IO on a Single ThreadRipper Workstation post, I was very impressed by the IO performance he achieved with NVMe storage.
Incidentally, a few weeks after reading this post ASUS started selling the Pro WS WRX80 SAGE motherboard with support for the newest AMD Ryzen ThreadRippr processors and 7 PCIe 4 slots. As we needed to expand our lab datacenter for a number of projects, we ordered the motherboard, with an AMD Ryzen ThreadRipper Pro 3955WX processor with 16 cores. This article describes our setup and the performance we achieved.
Hardware
- Asus Pro WS WRX80 SAGE motherboard
- 16-core AMD Ryzen ThreadRipper Pro 3955WX
- 128 GB RAM
- 2 Asus Hyper Quad PCIe adapter for 4 Gen 4 NVMe cards
- Samsung 980 Pro NVMe M.2 SSDs (2x256GB + 8 512GB)
- AquaTuning Alphacool Pro Aurora 360 cooling system
- Fractal Design E-ATX case.
- Cheap PCIe video card
Installation and configuration notes
We had a few surprises with this hardware :
The official list of water cooling systems provided by AMD for the Ryzen ThreadRipper processors is not updated and we initially ordered a Fractal Design Celsius S36 cooling system that was not compatible with the WRX80. We finally found a compatible one at AquaTuning.
The next surprise was that the motherboard comes with a PCIe Hyper Quad Gen 4 SSD adapter, but the cards are not sold separately in Europe, and we’re still waiting for a second unit.

BIOS Setup
The 2 256 GB M.2 SSDs were installed on the motherboard M.2 slots and were correctly recognized.
The SSDs mounted on the PCIe adapter needed (as described in Tanel’s article) the PCIe bandwidth has to be set to “RAID” mode as described in the BIOS manual :

This wa the only change we had to do. After that we could start our tests with 6 SSDs available.
I shall note that this system has also “only” 4 PCIe root complexes so we’ll need to be aware of the bottleneck when sharing a root complex with several PCIe cards.
So here’s the fine piece of hardware :

The AquaTuning cooling system is a bit psychodelic but it does a fine job in keeping temperatures stable.
Single SSD tests
On this machine I installed Ubuntu LTS 21.04.with linux kernel 5.11.0-22-generic.
For comparison’s sake I used the same scripts used by Tanel in his groundbreaking article 🙂
Single ssd test in direct mode with 3 workers and 4k reads :
$ sudo ./onessd.sh 3 /dev/nvme5n1 4k
onessd: (g=0): rw=randread, bs=(R) 4096B-4096B, (W) 4096B-4096B, (T) 4096B-4096B, ioengine=io_uring, iodepth=32
…
fio-3.25
Starting 3 processes
Jobs: 3 (f=3): [r(3)][0.6%][r=4440MiB/s][r=1137k IOPS][eta 59m:40s]
No surprises here so far, let’s see what dstat says
$ sudo  dstat -pcrmd
---procs--- --total-cpu-usage-- --io/total- ------memory-usage----- -dsk/total-
run blk new|usr sys idl wai stl| read writ| used free buff cach| read writ
3.0 0 2.1| 0 1 99 0 0| 178k 8.26 |1416M 124G 24.4M 347M| 695M 58k
2.0 0 0| 2 5 93 0 0|1137k 0 |1416M 124G 24.4M 347M|4441M 0
3.0 0 0| 2 5 93 0 0|1136k 140 |1416M 124G 24.4M 347M|4435M 592k
3.0 0 0| 2 5 93 0 0|1133k 0 |1416M 124G 24.4M 347M|4426M 0
3.0 0 0| 2 5 93 0 0|1132k 0 |1416M 124G 24.4M 347M|4423M 0
2.0 0 0| 2 5 94 0 0|1132k 0 |1416M 124G 24.4M 347M|4423M 0
3.0 0 0| 2 5 93 0 0|1133k 5.00 |1417M 124G 24.4M 347M|4425M 280k
2.0 0 0| 2 5 93 0 0|1134k 44.0 |1417M 124G 24.4M 347M|4430M 280k
3.0 0 0| 2 5 94 0 0|1133k 0 |1417M 124G 24.4M 347M|4427M 0
3.0 0 0| 1 5 93 0 0|1132k 0 |1417M 124G 24.4M 347M|4424M 0
It looks like indeed, as mentioned in Tanel’s article, we have a lower throughput with kernel 5.11 than with 5.8, although we note a lower cpu usage in kernel mode.
Large 1M read
$ sudo ./onessd.sh 3 /dev/nvme1n1 1m
onessd: (g=0): rw=randread, bs=(R) 1024KiB-1024KiB, (W) 1024KiB-1024KiB, (T) 1024KiB-1024KiB, ioengine=io_uring, iodepth=32
…
fio-3.25
Starting 3 processes
Jobs: 3 (f=3): [r(3)][0.7%][r=6816MiB/s][r=6815 IOPS][eta 59m:36s]
$ sudo dstat -pcrmd
---procs--- --total-cpu-usage-- --io/total- ------memory-usage----- -dsk/total-
run blk new|usr sys idl wai stl| read writ| used free buff cach| read writ
0 0 1.4| 0 1 99 0 0| 132k 6.47 |1507M 124G 24.6M 347M| 533M 43k
1.0 0 0| 0 1 99 0 0|13.6k 0 |1507M 124G 24.6M 347M|6818M 0
1.0 0 0| 0 1 99 0 0|13.6k 5.00 |1507M 124G 24.6M 347M|6812M 96k
1.0 0 0| 0 1 99 0 0|13.6k 0 |1507M 124G 24.6M 347M|6810M 0
1.0 0 0| 0 1 99 0 0|13.6k 0 |1507M 124G 24.6M 347M|6808M 0
So, again we seem to have lower throughput with this kernel.
Direct IO disabled and large 1M reads
And now the surprise.
$ sudo dstat -pcrmd
---procs--- --total-cpu-usage-- --io/total- ------memory-usage----- -dsk/total-
run blk new|usr sys idl wai stl| read writ| used free buff cach| read writ
3.0 0 0.8| 0 1 99 0 0|74.1k 5.07 |1516M 35.0G 88.6G 357M| 609M 31k
3.0 0 0| 0 9 91 0 0|5261 0 |1516M 32.5G 91.1G 357M|2630M 0
3.0 0 0| 0 9 91 0 0|4433 0 |1516M 30.3G 93.3G 357M|2215M 0
3.0 0 0| 0 9 91 0 0|3903 0 |1517M 28.4G 95.2G 357M|1952M 0
3.0 0 0| 0 9 91 0 0|3085 0 |1516M 26.9G 96.7G 357M|1542M 0
3.0 0 0| 0 9 91 0 0|2484 0 |1516M 25.7G 97.9G 357M|1242M 0
3.0 0 0| 0 9 91 0 0|1829 0 |1516M 24.8G 98.8G 357M| 914M 0
3.0 0 0| 0 9 91 0 0|1298 0 |1517M 24.1G 99.4G 357M| 649M 0
3.0 0 0| 0 9 91 0 0| 718 0 |1516M 23.8G 99.8G 357M| 359M 0
3.0 0 0| 0 9 91 0 0| 363 0 |1516M 23.6G 100G 357M| 182M 0
3.0 0 0| 0 9 91 0 0| 727 0 |1517M 32.4G 91.2G 357M| 282M 0
3.0 0 0| 0 9 91 0 0|3045 0 |1517M 46.5G 77.0G 357M|1521M 0
3.0 0 0| 0 9 91 0 0|3554 0 |1519M 56.1G 67.4G 359M|1570M 0
3.0 0 0| 0 9 91 0 0|1378 0 |1520M 61.0G 62.6G 359M| 626M 0
Yes. Even if the throughput dropped dramatically, the number or running processes remains 3. Let’s not also the IOPS fluctuation over time.
I ran a process snapper sample and to my surprise, I got just a plain
$ sudo  ./psn -G syscall,wchan
Linux Process Snapper v1.1.0 by Tanel Poder [https://0x.tools]
Sampling /proc/syscall, wchan, stat for 5 seconds… finished.
=== Active Threads ===================================================
    300 |        3.00 | (fio) | Running (ON CPU) | [running] | 0
samples | avg_threads | comm | state | syscall | wchan
samples: 100 (expected: 100)
total processes: 418, threads: 516
runtime: 5.08, measure time: 2.69
Increasing the sample time to 10 seconds and trying a few times finally got me something /
=== Active Threads =========================================================================samples | avg_threads | comm | state | syscall | wchan602 |        3.01 | (fio)       | Running (ON CPU) | [running]       | 0
   3 |        0.01 | (rcu_sched) | Running (ON CPU) | [kernel_thread] | rcu_gp_fqs_loop
   1 |        0.01 | (rcu_sched) | Running (ON CPU) | [running]       | 0

samples: 200 (expected: 200)
total processes: 418, threads: 516
We now add the kstack to the sample
$ sudo  ./psn -G syscall,wchan,kstack -d 10 | sed 's/->/\n/g'
Linux Process Snapper v1.1.0 by Tanel Poder [https://0x.tools]
Sampling /proc/syscall, stack, wchan, stat for 10 seconds… finished.
=== Active Threads ===================================================================================================================================================================================================================================================================================================================================================================================================================================================================================================================
samples | avg_threads | comm | state | syscall | wchan | kstack
    589 |        2.94 | (fio)        | Running (ON CPU) | [running]       | 0               | -    6 |        0.03 | (fio)        | Running (ON CPU) | [running]       | 0               | __x64_sys_io_uring_enter()
__do_sys_io_uring_enter()
io_submit_sqes()
io_submit_sqe()
io_queue_sqe()
__io_queue_sqe()
io_issue_sqe()
io_read()
io_iter_do_read()
blkdev_read_iter()
generic_file_read_iter()
generic_file_buffered_read()
mark_page_accessed()
activate_page()
pagevec_lru_move_fn()
5 | 0.03 | (rcu_sched) | Running (ON CPU) | [kernel_thread] | rcu_gp_fqs_loop | kthread()
rcu_gp_kthread()
rcu_gp_fqs_loop()
4 | 0.02 | (fio) | Running (ON CPU) | [running] | 0 | syscall_exit_to_user_mode()
exit_to_user_mode_prepare()
exit_to_user_mode_loop()
task_work_run()
io_req_task_submit()
__io_req_task_submit()
__io_queue_sqe()
io_issue_sqe()
io_read()
io_iter_do_read()
blkdev_read_iter()
generic_file_read_iter()
generic_file_buffered_read()
generic_file_buffered_read_get_pages()
page_cache_sync_ra()
force_page_cache_ra()
page_cache_ra_unbounded()
add_to_page_cache_lru()
1 | 0.01 | (fio) | Running (ON CPU) | [running] | 0 | __x64_sys_clock_nanosleep()
common_nsleep()
hrtimer_nanosleep()
1 | 0.01 | (fio) | Running (ON CPU) | [running] | 0 | syscall_exit_to_user_mode()
exit_to_user_mode_prepare()
exit_to_user_mode_loop()
task_work_run()
io_req_task_submit()
__io_req_task_submit()
__io_queue_sqe()
io_issue_sqe()
io_read()
io_iter_do_read()
blkdev_read_iter()
generic_file_read_iter()
generic_file_buffered_read()
generic_file_buffered_read_get_pages()
page_cache_sync_ra()
1 | 0.01 | (irqbalance) | Running (ON CPU) | [running] | 0 | -
1 | 0.01 | (rcu_sched) | Running (ON CPU) | [running] | 0 | kthread()
rcu_gp_kthread()
rcu_gp_fqs_loop()
samples: 200 (expected: 200)
total processes: 419, threads: 517
runtime: 10.15, measure time: 6.94
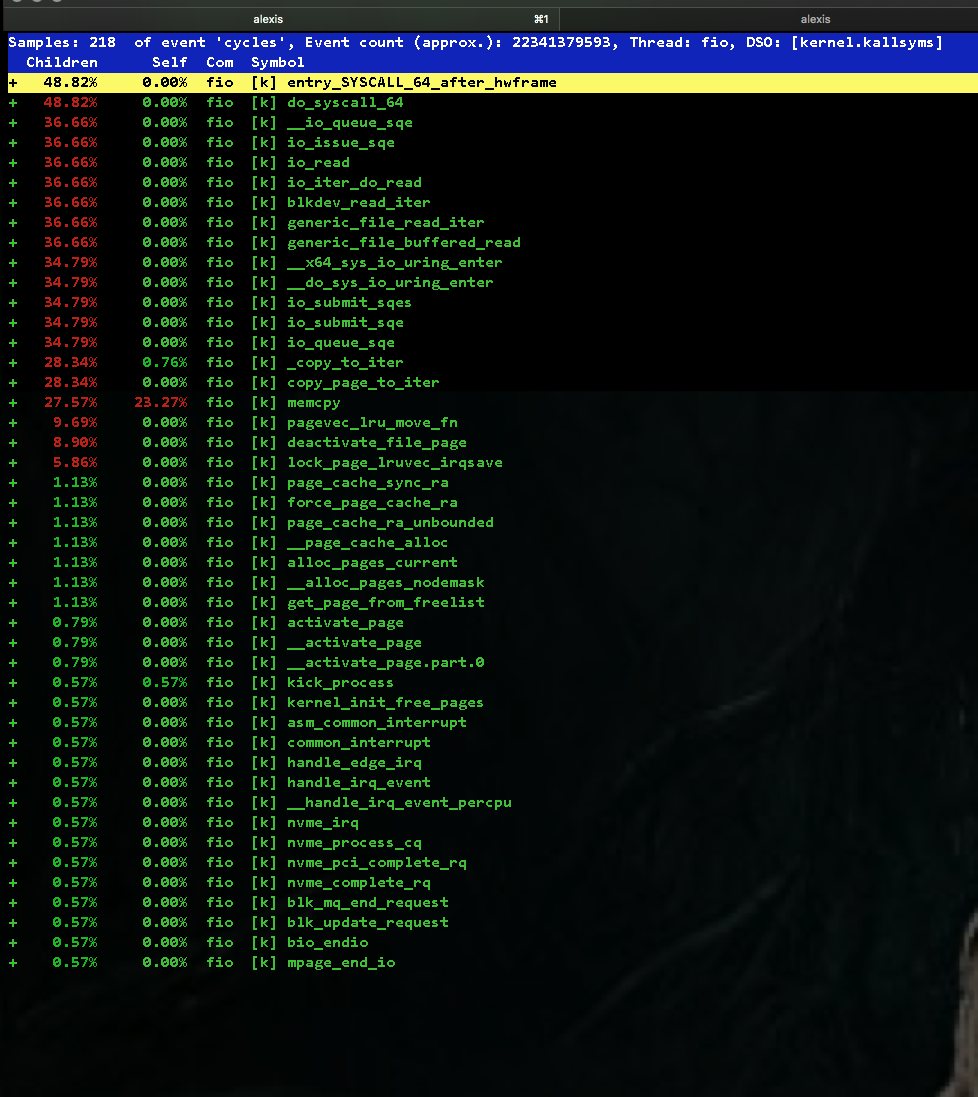
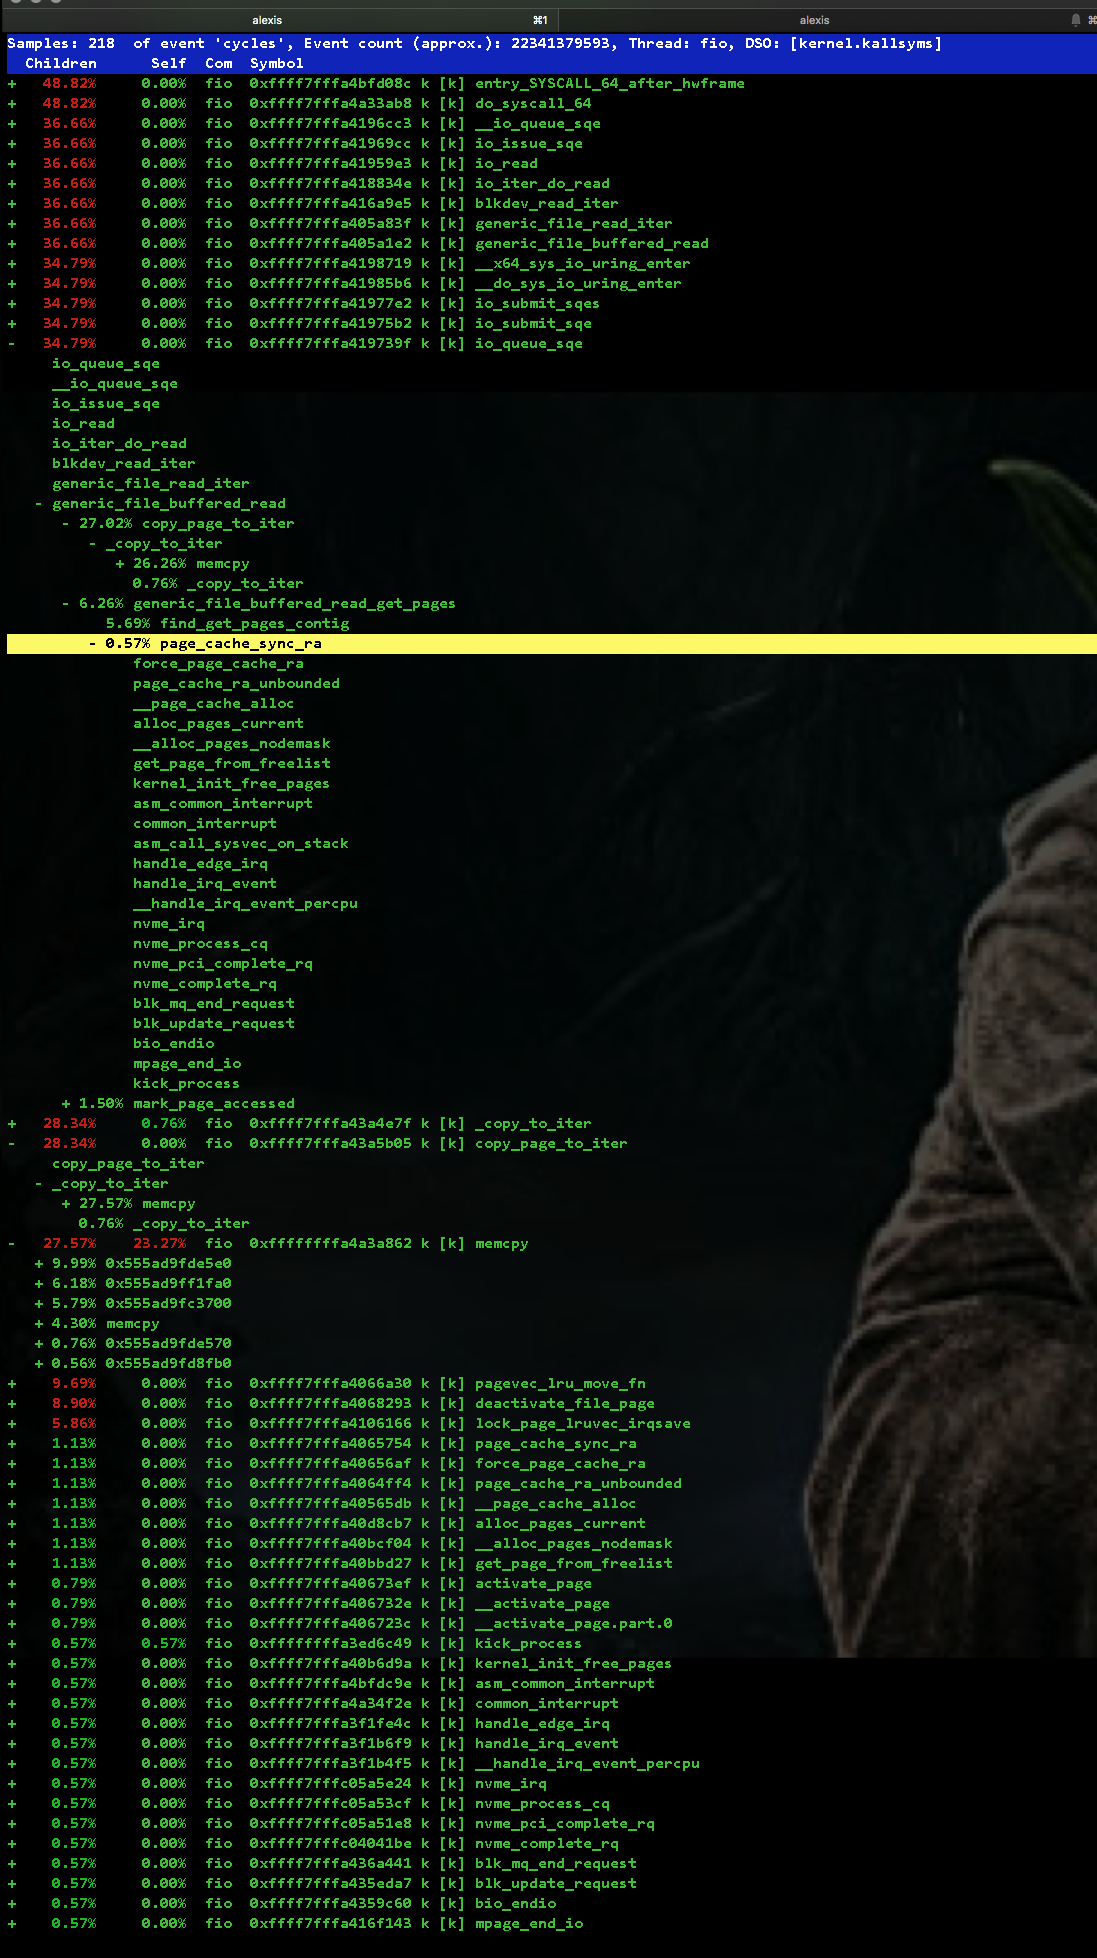
So, that doesn’t look that bad. We have no trace of the io_wqe_worker threads reported with the linux 5.8 kernel. There is read-ahead and page sync related events but the overall cpu usage is pretty good. Running a perf record with Tanel’s run_xcpu.sh script also showed no io_wqe workers. Here’s a zoom into the fio threads.
I digged a little further to seek for spinlocks but could not find significative samples of any spinlock-related events.
To make sure I wasn’t missing the spinlocks, I ran a more localized perf record to capture only kernel cycles events using EPBS (precisely) on all cpus for a few seconds :
$ sudo perf record -e cycles:kp -a
^C[ perf record: Woken up 23 times to write data ]
[ perf record: Captured and wrote 7.079 MB perf.data (127088 samples) ]
After that I could report the sample and search for the “spinlock” string :
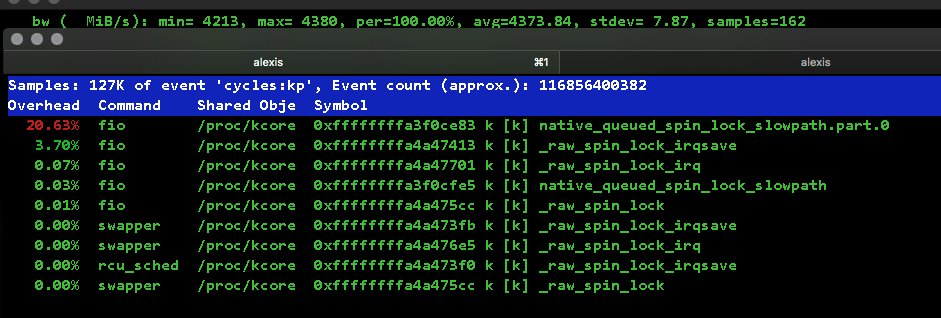
And this time we can spot these spinlocks, thus probably I didn’t expand the previous sample long enough to spot them, hidden in the flow of events.
Read-ahead
Now I’ll disable readahead on the test ssd and run again a test
$ sudo hdparm -a 0 /dev/nvme1n1
/dev/nvme1n1:
setting fs readahead to 0
readahead = 0 (off)
We ran again the test with direct IO disabled and readahead disabled as well. The results were quite disappointing :
--procs--- --total-cpu-usage-- --io/total- ------memory-usage----- -dsk/total-
run blk new|usr sys idl wai stl| read writ| used free buff cach| read writ
3.0 0 0.1| 0 1 99 0 0|10.5k 2.74 |1526M 53.8G 69.7G 395M| 142M 15k
3.0 0 0| 1 9 91 0 0| 537k 0 |1525M 51.8G 71.7G 395M|2096M 0
4.0 0 0| 0 9 91 0 0| 519k 0 |1525M 49.8G 73.7G 395M|2026M 0
3.0 0 0| 1 9 91 0 0| 507k 0 |1526M 47.8G 75.7G 395M|1981M 0
3.0 0 0| 1 9 91 0 0| 497k 141 |1526M 45.9G 77.6G 395M|1942M 624k
3.0 0 0| 1 9 91 0 0| 500k 0 |1526M 44.0G 79.5G 395M|1952M 0
3.0 0 0| 1 9 91 0 0| 487k 0 |1526M 42.2G 81.3G 395M|1900M 0
3.0 0 0| 1 9 91 0 0| 471k 0 |1526M 40.4G 83.1G 395M|1840M 0
3.0 0 0| 0 9 91 0 0| 457k 0 |1526M 38.6G 84.9G 395M|1786M 0
As in Tanel’s case, both IOPS and IO bandwidth drop to zero after 20 seconds or so and start again to decrease in a slow decay saw teth pattern.
Running a perf trace again we get
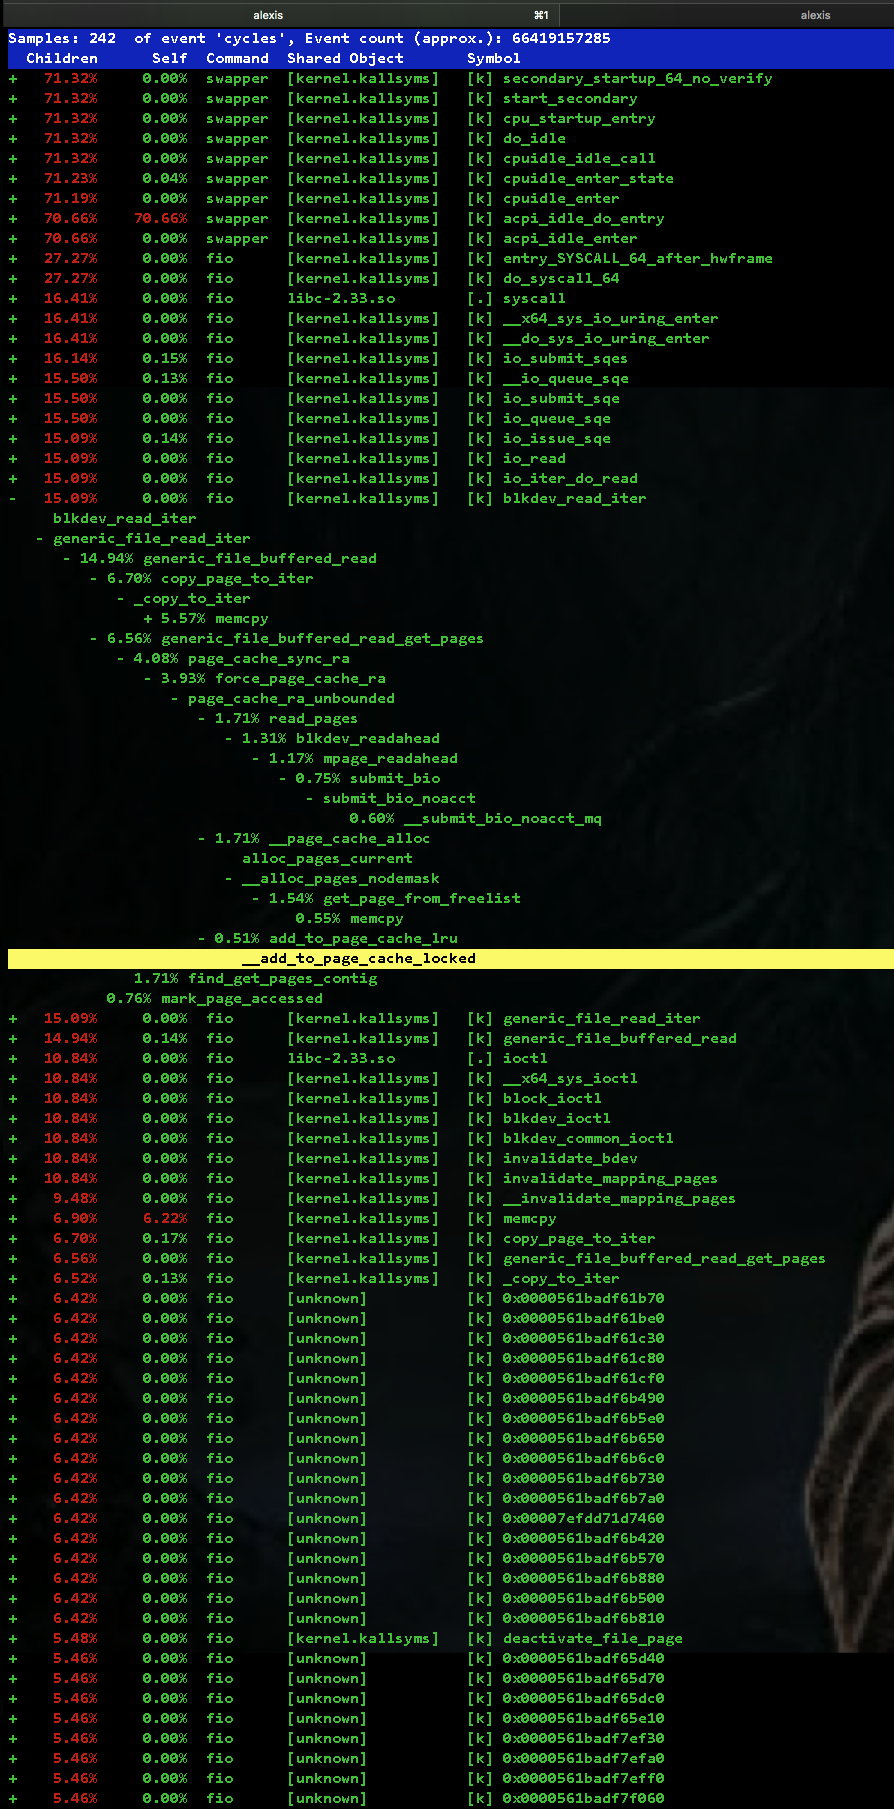
Again, no io_wqe_worker and no trace of spinlocks or attempts to free pages here. To my great surprise, there doesn’t seem to be any concurrent worker threads and no spinlock storm, as opposed to Tanel’s test results. Hardware being “almost” the same (with a few motherboard differences), it looks like kernel 5.11 brings quite some enhancements not only on io_uring. Further analysis is required here.
IO Scheduler
All tests have been done with the IO scheduler disabled (default for nvme devices). I’ll test now mq-deadline to see how the system behaves.
$ sudo echo mq-deadline > /sys/block/nvme1n1/queue/scheduler
$ sudo cat /sys/block/nvme1n1/queue/scheduler
[mq-deadline] none
We run now the same single-ssd test with direct=1 and 1M reads. Remember read-ahead is still disabled on the nvme1n1 device.
--procs--- --total-cpu-usage-- --io/total- ------memory-usage----- -dsk/total-
run blk new|usr sys idl wai stl| read writ| used free buff cach| read writ
0 0 0.1| 0 0 100 0 0|7647 2.72 |1552M 123G 58.5M 624M| 193M 19k
0 0 1.0| 0 1 99 0 0|13.6k 218 |1553M 123G 58.5M 624M|6820M 984k
0 0 0| 0 1 99 0 0|13.6k 0 |1553M 123G 58.5M 624M|6807M 0
0 0 0| 0 1 99 0 0|13.6k 0 |1553M 123G 58.5M 624M|6812M 0
1.0 0 0| 0 1 99 0 0|13.6k 0 |1553M 123G 58.5M 624M|6810M 0
0 0 0| 0 1 99 0 0|13.6k 7.00 |1553M 123G 58.6M 624M|6812M 40k
1.0 0 0| 0 1 99 0 0|13.6k 0 |1553M 123G 58.6M 624M|6810M 0
0 0 0| 0 1 99 0 0|13.6k 0 |1553M 123G 58.6M 624M|6810M 0
0 0 0| 0 1 99 0 0|13.6k 0 |1553M 123G 58.6M 624M|6812M 0
0 0 0| 0 1 99 0 0|13.6k 0 |1553M 123G 58.6M 624M|6809M 0
1.0 0 0| 0 1 99 0 0|13.6k 0 |1553M 123G 58.6M 624M|6810M 0
Interesting. We’re doing 6.8 GiB/s with only 1 runnable process (we’re runnign the test with 3 workers) and almost 0 cpu load. Let’s see what processSnapper tells us
$ sudo ./psn -G syscall,wchan -d 10
Linux Process Snapper v1.1.0 by Tanel Poder [https://0x.tools]
Sampling /proc/syscall, wchan, stat for 10 seconds… finished.
=== Active Threads =================================================================
samples | avg_threads | comm | state | syscall | wchan
   36 |        0.18 | (fio) | Running (ON CPU) | [running]      | 0   14 |        0.07 | (fio) | Running (ON CPU) | io_uring_enter | 0    6 |        0.03 | (fio) | Running (ON CPU) | io_uring_enter | io_cqring_wait

samples: 200 (expected: 200)
total processes: 422, threads: 528
runtime: 10.15, measure time: 5.54
We run a perf record

Again, we don’t observe IO scheduler overhead. There is a fundamentally different way IO work is being scheduled, either buffered or not, in kernnel 5.11 compared to 5.8 and it is possible that it’s due to the introduction of a new asynchronous IO API in kernel 5.9.
Mutiple SSD test
I’ll now test the results with the 6 available SSDs. Let’s start with a concurrent 4k fio load. I’m running the test in direct mode with the IO scheduler disabled (we check it first).
$ sudo cat /sys/block/nvmen1/queue/scheduler
[none] mq-deadline
[none] mq-deadline
[none] mq-deadline
[none] mq-deadline
[none] mq-deadline
[none] mq-deadline
$sudo hdparm /dev/nvmen1 |grep readahead
readahead = 256 (on)
readahead = 256 (on)
readahead = 256 (on)
readahead = 256 (on)
readahead = 256 (on)
readahead = 256 (on)

$ sudo ./allmulti.sh 4k
[1]   Running                 ./onessd.sh 3 /dev/nvme0n1 $1 &
[2]   Running                 ./onessd.sh 3 /dev/nvme1n1 $1 &
[3]   Running                 ./onessd.sh 3 /dev/nvme2n1 $1 &
[4]   Running                 ./onessd.sh 3 /dev/nvme3n1 $1 &
[5]-  Running                 ./onessd.sh 3 /dev/nvme4n1 $1 &
[6]+  Running                 ./onessd.sh 3 /dev/nvme5n1 $1 &
...
$ sudo dstat -pcmrd
---procs--- --total-cpu-usage-- ------memory-usage----- --io/total- -dsk/total-
run blk new|usr sys idl wai stl| used  free  buff  cach| read  writ| read  writ
 14   0 0.1|  0   0 100   0   0|1545M  124G 20.3M  411M|11.7k 2.52 | 433M   19k
 16   0   0| 11  30  59   0   0|1545M  124G 20.3M  411M|6227k    0 |  24G    0
 12   0   0| 12  29  59   0   0|1545M  124G 20.3M  411M|6215k    0 |  24G    0
 13   0   0| 11  30  59   0   0|1545M  124G 20.3M  411M|6207k    0 |  24G    0
 17   0   0| 11  30  59   0   0|1545M  124G 20.3M  411M|6199k    0 |  24G    0
 14   0   0| 11  30  59   0   0|1545M  124G 20.3M  411M|6212k    0 |  24G    0
 14   0   0| 11  30  59   0   0|1545M  124G 20.3M  411M|6209k    0 |  24G    0
 15   0   0| 11  30  59   0   0|1545M  124G 20.3M  411M|6227k    0 |  24G    0
 12   0   0| 11  30  59   0   0|1545M  124G 20.3M  411M|6219k    0 |  24G    0
We reach 6220K IOPS and 24 GiB/s over 6 SSDs
Let’s now increase read size to 512k and run the test again
run blk new|usr sys idl wai stl| used  free  buff  cach| read  writ| read  writ
1.0   0 0.1|  0   0 100   0   0|1785M  123G 20.5M  411M|16.2k 2.50 | 449M   19k
  0   0   0|  0   4  96   0   0|1787M  123G 20.5M  411M|80.7k    0 |  39G    0
3.0   0   0|  0   4  96   0   0|1787M  123G 20.5M  411M|80.5k    0 |  39G    0
1.0   0   0|  0   4  96   0   0|1787M  123G 20.5M  411M|80.8k    0 |  39G    0
  0   0   0|  0   4  96   0   0|1787M  123G 20.5M  411M|80.7k 5.00 |  39G   40k
1.0   0   0|  0   4  96   0   0|1788M  123G 20.5M  411M|80.7k    0 |  39G    0
3.0   0   0|  1   3  96   0   0|1787M  123G 20.5M  411M|80.5k    0 |  39G    0
1.0   0   0|  0   4  96   0   0|1788M  123G 20.5M  411M|80.8k    0 |  39G    0
1.0   0   0|  0   4  96   0   0|1788M  123G 20.5M  411M|80.6k    0 |  39G    0
  0   0   0|  0   4  96   0   0|1788M  123G 20.5M  411M|80.7k    0 |  39G    0
  0   0   0|  0   4  96   0   0|1788M  123G 20.5M  411M|80.6k    0 |  39G    0
That’s 80,6K IOPS and 39 GiB/s. Notice now the processor load dropped dramatically.
I ran the same test with increasing read sizes of 8k, 16k, etc. I noticed the maximum throughput was reached with 64k reads (39 GiB/s) and the cpu usage decreased progressively.
UPDATE – Test with kernel kernel 5.8.18-generic
I installed and booted from kernel 5.8.18-generic and ran the same single-ssd test with 4K reads.
Direct mode
$ sudo uname -r
Linux limbo 5.8.18-050818-generic
$ sudo ./onessd.sh 3 /dev/nvme1n1 4k
onessd: (g=0): rw=randread, bs=(R) 4096B-4096B, (W) 4096B-4096B, (T) 4096B-4096B, ioengine=io_uring, iodepth=32
…
fio-3.25
Starting 3 processes
Jobs: 3 (f=3): [r(3)][2.6%][r=6968MiB/s][r=1784k IOPS][eta 58m:25s]And on another terminal I checked dstat and ran a processSnapper trace.
$ sudo dstat -pcmrd
---procs--- --total-cpu-usage-- ------memory-usage----- --io/total- -dsk/total-
run blk new|usr sys idl wai stl| used free buff cach| read writ| read writ
3.0 0 1.9| 0 4 95 1 0|1521M 124G 22.5M 373M|85.1k 4.81 |1901M 36k
3.0 0 0| 3 8 89 0 0|1521M 124G 22.5M 373M| 499k 0 |1950M 0
3.0 0 0| 3 8 88 0 0|1521M 124G 22.5M 373M| 498k 0 |1944M 0
3.0 0 0| 3 8 88 0 0|1521M 124G 22.5M 373M| 498k 0 |1943M 0
3.0 0 0| 3 8 89 0 0|1521M 124G 22.5M 373M| 498k 0 |1944M 0
3.0 0 0| 3 8 89 0 0|1521M 124G 22.5M 373M| 498k 0 |1945M 0
3.0 0 0| 3 8 89 0 0|1521M 124G 22.5M 373M| 498k 0 |1947M 0 ^C

$ sudo ./psn -G syscall,wchan
Linux Process Snapper v1.1.0 by Tanel Poder [https://0x.tools]
Sampling /proc/syscall, stat, wchan for 5 seconds… finished.
=== Active Threads ==========================================================================samples | avg_threads | comm | state | syscall | wchan300 |        3.00 | (fio)                | Running (ON CPU) | [running] | 0    1 |        0.01 | (kworker/u*:*+ixgbe) | Running (ON CPU) | [running] | worker_threadsamples: 100 (expected: 100)
total processes: 419, threads: 517
runtime: 5.08, measure time: 3.20
Nothing surprising here as the figures are the same as with kernel 5.11.
Let’s do the same test in buffered mode.
Direct I/O disabled and large reads
$ sudo ./onessd.sh 3 /dev/nvme1n1 1m
onessd: (g=0): rw=randread, bs=(R) 1024KiB-1024KiB, (W) 1024KiB-1024KiB, (T) 1024KiB-1024KiB, ioengine=io_uring, iodepth=32
...
fio-3.25
Starting 3 processes
Jobs: 3 (f=3): [r(3)][1.6%][r=12.2GiB/s][r=12.5k IOPS][eta 59m:04s]
$ sudo dstat -pcmrd
---procs--- --total-cpu-usage-- ------memory-usage----- --io/total- -dsk/total-
run blk new|usr sys idl wai stl| used  free  buff  cach| read  writ| read  writ
5.0 1.0 1.1|  0   4  95   1   0|1609M 38.2G 85.2G  407M|59.5k 3.30 |1046M   23k
8.0   0   0|  0  20  77   3   0|1609M 34.9G 88.5G  407M|7382     0 |3395M    0
5.0 2.0   0|  0  18  79   2   0|1609M 32.0G 91.4G  407M|6219     0 |2894M    0
9.0   0   0|  0  16  81   2   0|1610M 29.7G 93.6G  408M|5189     0 |2348M    0
4.0   0   0|  0  15  83   1   0|1609M 28.0G 95.4G  408M|3988     0 |1831M    0
5.0   0   0|  0  14  84   1   0|1609M 26.4G 96.9G  408M|3482     0 |1539M    0
3.0   0   0|  0  13  86   1   0|1609M 25.3G 98.1G  408M|2864     0 |1221M    0
3.0   0   0|  0  12  87   1   0|1609M 24.4G 99.0G  408M|2115     0 | 892M    0 ^C
Now this is totally different. Runnable processes now reach 9 and the kernel is taking more cpu. Let’s have a look at what fio is actually doing with processSnapper
$ sudo ./psn -G syscall,wchan
Linux Process Snapper v1.1.0 by Tanel Poder [https://0x.tools]
Sampling /proc/syscall, stat, wchan for 5 seconds… finished.

=== Active Threads ===========================================================================

samples | avg_threads | comm | state | syscall | wchan

    2055 |       20.55 | (io_wqe_worker-*)    | Running (ON CPU)       | [running]     | 0
     776 |        7.76 | (io_wqe_worker-*)    | Disk (Uninterruptible) | [kernel_thread] | wait_on_page_bit_common
     249 |        2.49 | (fio)                | Running (ON CPU)       | [running]       | 0
      33 |        0.33 | (io_wqe_worker-*)    | Running (ON CPU)       | [running]       | wait_on_page_bit_common
      18 |        0.18 | (io_wqe_worker-*)    | Running (ON CPU)       | [kernel_thread] | 0
      17 |        0.17 | (io_wqe_worker-*)    | Disk (Uninterruptible) | [kernel_thread] | 0
      12 |        0.12 | (io_wqe_worker-*)    | Disk (Uninterruptible) | [running]       | wait_on_page_bit_common
      10 |        0.10 | (kworker/*:*-events) | Running (ON CPU)       | [running]       | 0
       2 |        0.02 | (fio)                | Running (ON CPU)       | [running]       | io_cqring_wait
       2 |        0.02 | (fio)                | Running (ON CPU)       | io_uring_enter  | 0
       2 |        0.02 | (kworker/*:*-events) | Running (ON CPU)       | [kernel_thread] | worker_thread
       1 |        0.01 | (fio)                | Running (ON CPU)       | clock_nanosleep | 0
       1 |        0.01 | (kworker/*:*-events) | Running (ON CPU)       | [running]       | worker_thread

samples: 100 (expected: 100)
total processes: 511, threads: 610
runtime: 5.14, measure time: 4.37
Bingo ! We now see the io_wqe_worker kernel workers. Lets now sample with the kstack included
$ sudo ./psn -G syscall,wchan,kstack | sed 's/->/\n/g'
Linux Process Snapper v1.1.0 by Tanel Poder [https://0x.tools]
Sampling /proc/syscall, wchan, stack, stat for 5 seconds... finished.

=== Active Threads =========================================================================================================================================================================================================================================================================================================================================================================================================================================================================================================

samples | avg_threads | comm                   | state                  | syscall         | wchan                   | kstack
----------------------------------------------------------------------------------------------------------------------------------------------------------------------------------------------------------------------------------------------------------------------------------------------------------------------------------------------------------------------------------------------------------------------------------------------------------------------------------------------------------------------------

     473 |        4.73 | (io_wqe_worker-*)      | Running (ON CPU)       | [running]       | 0                       | -
     292 |        2.92 | (fio)                  | Running (ON CPU)       | [running]       | 0                       | -
     129 |        1.29 | (io_wqe_worker-*)      | Disk (Uninterruptible) | [kernel_thread] | wait_on_page_bit_common | kthread()
io_wqe_worker()
io_worker_handle_work()
io_wq_submit_work()
io_issue_sqe()
io_read()
blkdev_read_iter()
generic_file_read_iter()
generic_file_buffered_read()
wait_on_page_bit_common()
      20 |        0.20 | (io_wqe_worker-*)      | Running (ON CPU)       | [kernel_thread] | wait_on_page_bit_common | kthread()
io_wqe_worker()
io_worker_handle_work()
io_wq_submit_work()
io_issue_sqe()
io_read()
blkdev_read_iter()
generic_file_read_iter()
generic_file_buffered_read()
wait_on_page_bit_common()
      13 |        0.13 | (io_wqe_worker-*)      | Running (ON CPU)       | [kernel_thread] | 0                       | -
       6 |        0.06 | (fio)                  | Running (ON CPU)       | [running]       | 0                       | __x64_sys_io_uring_enter()
__do_sys_io_uring_enter()
io_submit_sqes()
       5 |        0.05 | (io_wqe_worker-*)      | Disk (Uninterruptible) | [running]       | 0                       | -
       4 |        0.04 | (io_wqe_worker-*)      | Running (ON CPU)       | [running]       | 0                       | kthread()
io_wqe_worker()
io_worker_handle_work()
io_wq_submit_work()
io_issue_sqe()
io_read()
blkdev_read_iter()
generic_file_read_iter()
generic_file_buffered_read()
page_cache_sync_readahead()
force_page_cache_readahead()
page_cache_readahead_unbounded()
add_to_page_cache_lru()
__add_to_page_cache_locked()
mem_cgroup_charge()
mem_cgroup_charge_statistics.constprop.0()
       3 |        0.03 | (io_wqe_worker-*)      | Disk (Uninterruptible) | [running]       | 0                       | kthread()
io_wqe_worker()
io_worker_handle_work()
io_wq_submit_work()
io_issue_sqe()
io_read()
The Asynchronous IO API
The work done to allow asynchronous I/O in io_uring goes far ago. As one could read, this is a stepstone top enable userspace to call any system call asynchronously. We read, in the LWN.net post “Redesigned workqueues for io_uring” :
That said, there may be more coming. Long-time LWN readers may remember a series of discussions in 2007 for an in-kernel mechanism called, at times, fibrils, threadlets, or syslets. Regardless of the name, this mechanism was intended to improve asynchronous I/O support, but there was another motive as well: to allow user space to run any system call asynchronously. None of those mechanisms reached a point of being seriously considered for merging, but it seems that they were not forgotten. In patch two of the series, Axboe notes that using io-wq in io_uring “gets us one step closer to adding async support for any system call”. It thus seems that we can expect io_uring to develop the capabilities that were envisioned almost 13 years ago. Stay tuned for further developments.
Conclusion
Modern hardware is impressively fast. The best performance I could achieve during the single-SSD tests were of 6.8GiB/s at 13.8 IOPS with 1M reads and 4,4GiB/s at 1,1M IOPS with 4K reads. Results with 6 concurrent SSDs and 5 fio jobs yielded 39 GiB/s while maintaining a comfortable cpu utilization, leaving room for extra IO. My main use case for this server is to become a KVM hypervisor for clustering tests, as KVM is reaching higher levels of stability and performance (for the record, new Amazon AWS EC2 C5 instances run on KVM). I’m therefore pretty happy with the results.
An interesting finding was that enhancements in io_uring in kernel 5.9 (asynchronous IO API) seem to do increase IO throughput in buffered mode. As the cpu utilization remains very low even when using mq-deadline as IO scheduler, concurrent IO workloads on multiple nvme ssds may probably reach a higher throughput. Next tests will focus on multiple ssds with the linux kernel 5.11.

Alexis
Alexis is the founder of Aleph Technologies, a data infrastructure consulting and professional services provider based in Brussels, Belgium.
Follow Me:
